Where Kubernetes money actually goes
When engineering teams notice their cloud bill is higher than expected and trace it to Kubernetes, the instinct is usually to look at the workloads they actively manage. The application pods. The databases. The services they deployed last quarter.
In our experience auditing clusters, those are rarely where the cost problem lives. The cost problem lives in three other places:
- Resource requests set conservatively years ago and never reviewed
- Namespaces and workloads that nobody is using but nobody deleted
- Node provisioning that doesn't match actual workload patterns
None of these show up in a dashboard view of active services. They accumulate in the background while the team is focused on building things.
Resource requests: the quiet cost driver
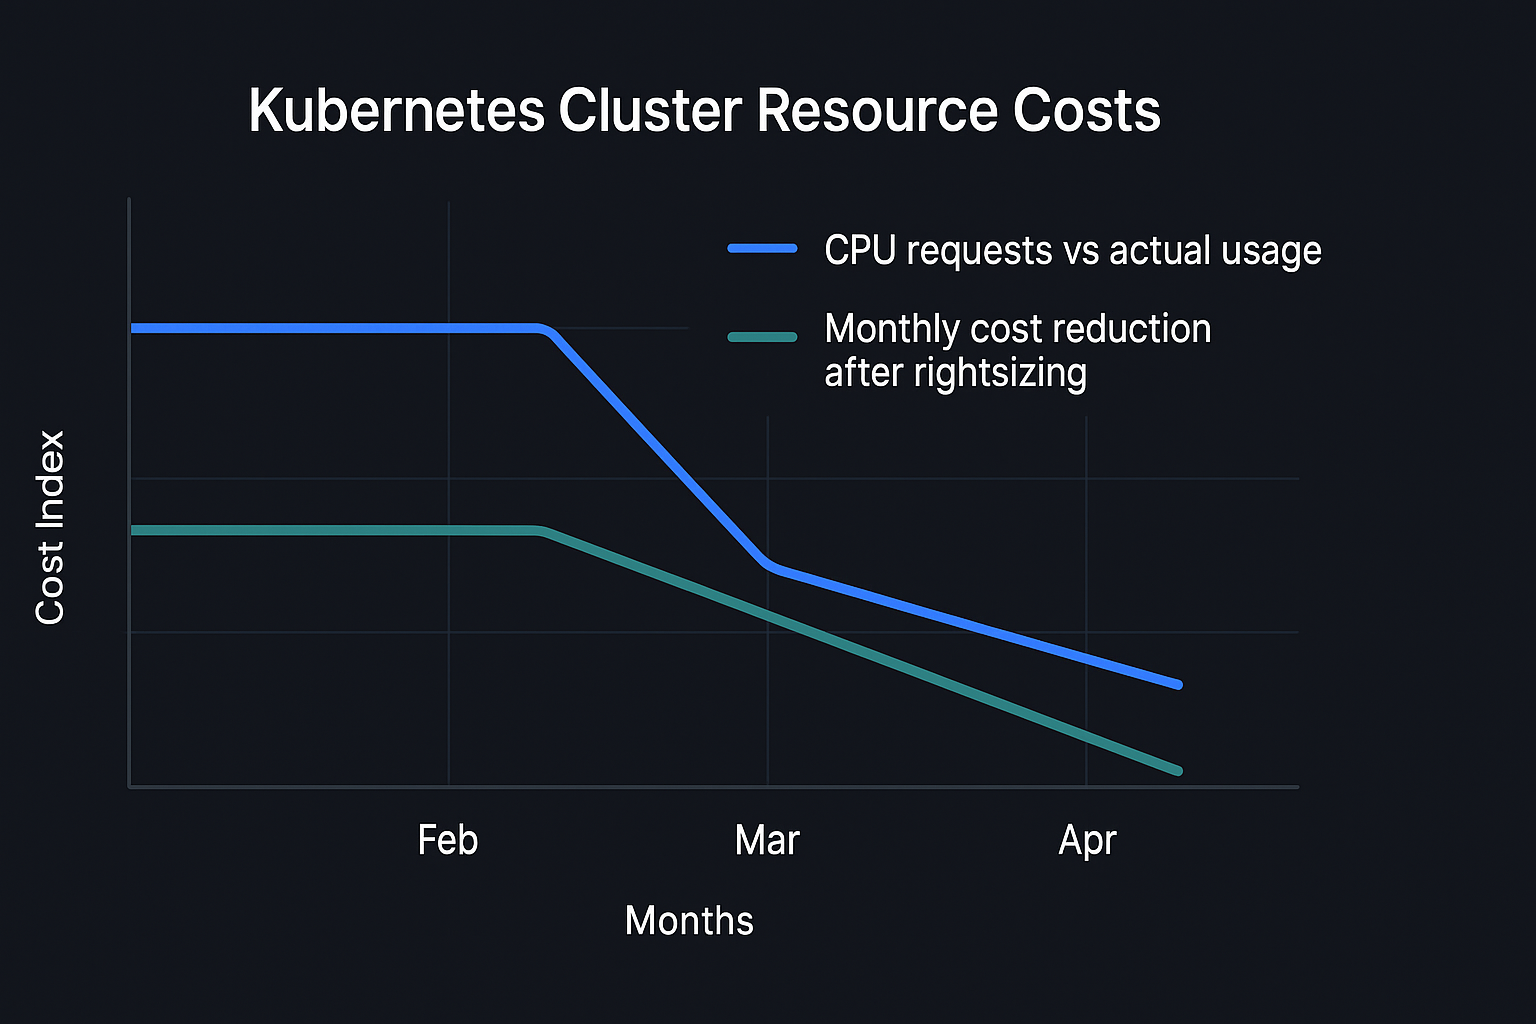
Kubernetes schedules pods based on their resource requests — the CPU and memory values that tell the scheduler how much capacity to reserve. When requests are set too high relative to actual usage, you pay for capacity you never consume.
This is a surprisingly common situation because requests are usually set conservatively when a service is first deployed and then forgotten. A service that was launched with a 500m CPU request because the team wasn't sure of the actual requirement might be using 80m in steady state. Across a cluster with dozens of services, this compounds significantly.
The fix is straightforward: use Vertical Pod Autoscaler (VPA) in recommendation mode to observe actual usage over a period of time, then review the recommendations and adjust requests accordingly. VPA in recommendation mode won't make changes automatically — it produces suggestions that a human reviews first. This is the right approach; you want to understand the suggestions before applying them.
One caveat: some workloads have bursty resource usage that doesn't show up in average metrics. Check peak usage, not just average, before reducing requests on latency-sensitive services.
Dead namespaces and orphaned workloads
Every cluster accumulates namespaces from projects that ended, features that were removed, or environments that were deprecated without being properly cleaned up. These are often running at low resource usage — low enough that they don't appear in any cost alert — but at cluster scale they add up.
A practical approach to finding these: look at namespaces where there have been no deployments in the last 90 days. Cross-reference with your team's knowledge of what's still actively used. For anything unclear, set it to zero replicas for two weeks and see if anyone notices. If nobody notices, delete it.
The same logic applies to individual workloads within active namespaces: CronJobs that ran once and were never cleaned up, Deployments for services that were replaced, ConfigMaps and Secrets for systems that no longer exist. A namespace audit — going through every resource type and asking "is this still needed?" — is tedious but useful.
Node provisioning and Spot instances
Cluster autoscaler manages when nodes are added and removed, but the node types it provisions are determined by the node group configuration. If your node groups are set to provision large instances when a small number of pods request medium amounts of resources, you're paying for unused capacity at the node level.
The right configuration depends on your workload profile. For clusters with many small pods, smaller instance types with more nodes can be more cost-efficient. For clusters with a small number of resource-intensive pods, fewer larger instances work better. Most clusters that haven't been reviewed fall somewhere in between and could benefit from a node group configuration audit.
Spot instances (or Spot-equivalent capacity in GCP and Azure) are a significant cost reduction lever for workloads that tolerate interruption. Batch jobs, background processing, development environments, and stateless web services with proper shutdown handling are all good candidates. Stateful workloads and latency-sensitive services are not.
A mixed node group configuration — on-demand instances for critical workloads, Spot for interruptible workloads — is achievable with node labels and pod affinity rules. The setup is not trivial but the cost reduction can be substantial.
What not to cut
Cost reduction work in Kubernetes has a failure mode: cutting something that appears idle but isn't. Before making changes, check:
- Monitoring and observability infrastructure. If you reduce the resources available to your metrics collection or log aggregation, you lose visibility precisely when you need it most.
- System-level daemonsets. Things like node-local DNS, logging agents, and security tooling run on every node for a reason. Cutting their resource limits creates unpredictable failures.
- PodDisruptionBudgets. If you're cleaning up workloads that have PDBs set, understand what those PDBs protect before changing them.
A cost reduction that introduces a reliability problem is not a cost reduction — it's a future incident that will cost more to remediate than you saved.
A reasonable starting point
If you're not sure where to start, the order we'd recommend: namespace audit first (find the dead weight), then resource request review (find the waste in active workloads), then node configuration (optimise provisioning once you know what you actually need). Spot instances last, after you've validated which workloads can tolerate interruption.
Most clusters we audit have recoverable spend in the 20–35% range from the first two steps alone, without touching anything that affects reliability.